a = lo(numbers).rgb.fig # matplotlib figure
print(type(a))
a
<class 'matplotlib.figure.Figure'>
.fig.rgb, .chans and .plt all have a .fig attribute that returns a matplotlib figure object.
a = lo(numbers).rgb.fig # matplotlib figure
print(type(a))
a<class 'matplotlib.figure.Figure'>
lo(numbers).chans.fig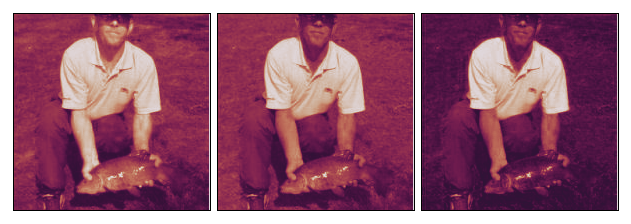
lo(numbers).plt.fig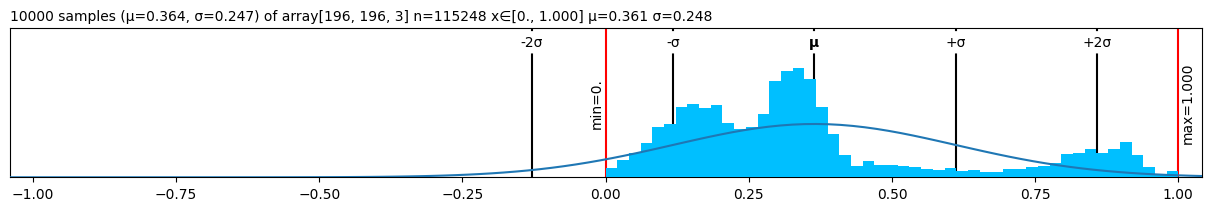
lo(numbers).plt(center="mean").fig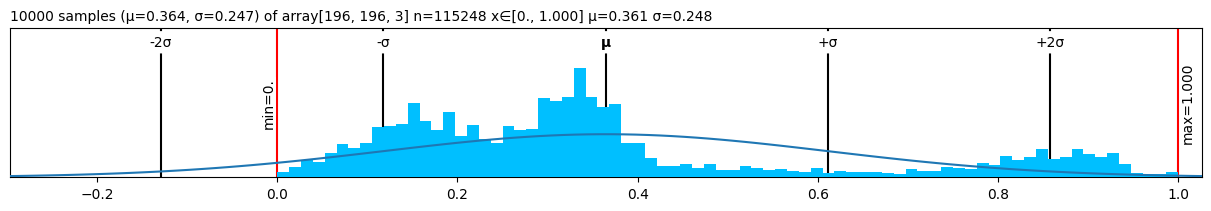
You can save the figure by calling its savefig method:
lo(numbers).rgb.fig.savefig("tench.jpg")!file tench.jpg; rm tench.jpgtench.jpg: JPEG image data, JFIF standard 1.01, resolution (DPI), density 100x100, segment length 16, baseline, precision 8, 196x196, components 3AxesAll functions allow an ax= argument that accepts an existing Axes object into which they will plot:
fig = plt.figure(figsize=(8,3))
fig.set_constrained_layout(True)
gs = fig.add_gridspec(2,2)
ax1 = fig.add_subplot(gs[0, :])
ax2 = fig.add_subplot(gs[1, 0])
ax3 = fig.add_subplot(gs[1,1:])

ax2.set_axis_off()
ax3.set_axis_off()

lo(numbers).plt(ax=ax1)
lo(numbers).rgb(ax=ax2)
lo(numbers).chans(ax=ax3);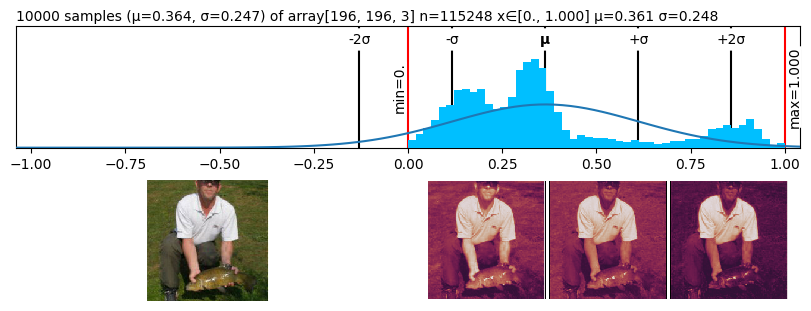
By default, the Lovely functions will call plt.close(fig) on the figures they create.
This prevents displaying the figures twice when running in Jupyter.
If you are not using Jupyter, here are 2 configuration options you might want to set:
fig_close=False
#!/usr/bin/env python
from lovely_numpy import config, set_config, lo

...

set_config(fig_close=False)
lo(numbers).chans()

# or, using the context manager:
with config(fig_close=False):
    lo(numbers).chans()

plt.show() # Will show all open figures
fig_show=True
If set, lovely will call plt.show() after each figure creation.
You don’t need to set fig_close=False manually.
set_config(fig_show=True)

lo(numbers).chans() # Figure generated and shown

# Note, you have to use the "call" syntax `( )`, as figure
# generation is not triggerd by just accessing the attribute

lo(numbers).chans  # No figure generated

f = lo(numbers).plt.fig # figure generated, shown, and returned.
Note, plt.show() closes all figures.