monkey_patch()🖌️ View as RGB images
rgb
 rgb (x:jax.Array, denorm:Any=None, cl:Any=True, gutter_px:int=3,
      frame_px:int=1, scale:int=1, view_width:int=966,
      ax:Optional[matplotlib.axes._axes.Axes]=None)
| Type | Default | Details | |
|---|---|---|---|
| x | Array | Tensor to display. [[…], C,H,W] or [[…], H,W,C] | |
| denorm | Any | None | Reverse per-channel normalizatoin |
| cl | Any | True | Channel-last |
| gutter_px | int | 3 | If more than one tensor -> tile with this gutter width |
| frame_px | int | 1 | If more than one tensor -> tile with this frame width |
| scale | int | 1 | Scale up. Can’t scale down. |
| view_width | int | 966 | target width of the image |
| ax | Optional | None | Use this Axes |
| Returns | RGBProxy |
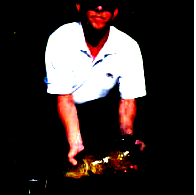
rgb(image)
rgb(image, scale=2)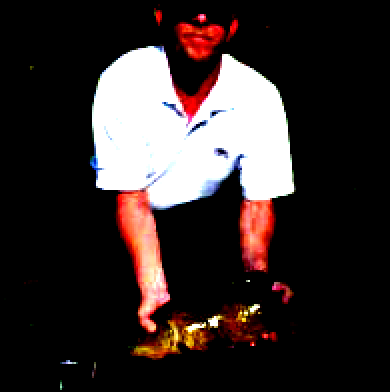
two_images = jnp.stack([image]*2)
two_images
Array[2, 196, 196, 3] n=230496 (0.9Mb) x∈[-2.118, 2.640] μ=-0.388 σ=1.073 cpu:0in_stats = ( (0.485, 0.456, 0.406), # Mean
(0.229, 0.224, 0.225) ) # std
rgb(two_images, denorm=in_stats)
# Make 8 images with progressively higher brightness and stack them 2x2x2.

eight_images = (jnp.stack([image]*8) + jnp.linspace(-2, 2, 8)[:,None,None,None])
eight_images = (eight_images
                     *jnp.array(in_stats[1])
                     +jnp.array(in_stats[0])
                ).clip(0,1).reshape(2,2,2,196,196,3)

eight_images
Array[2, 2, 2, 196, 196, 3] n=921984 (3.5Mb) x∈[0., 1.000] μ=0.382 σ=0.319 cpu:0rgb(eight_images)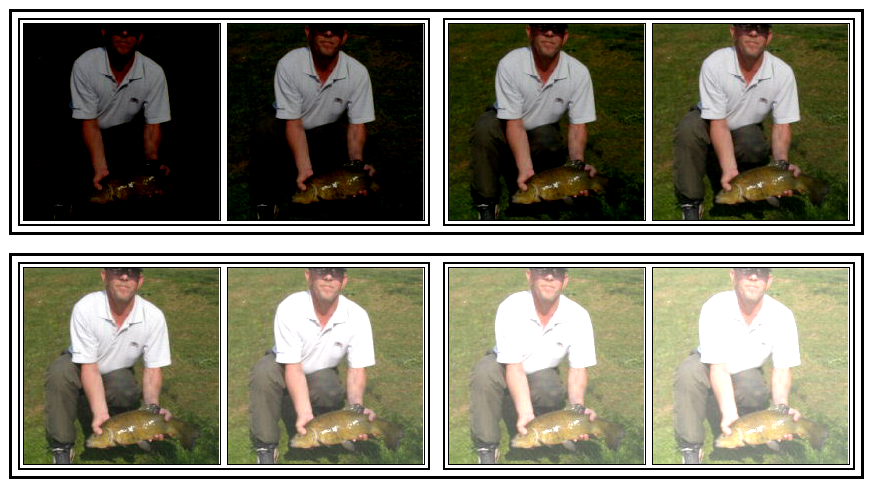
# You can do channel-last too:
rgb(image.transpose(2, 0, 1), cl=False)