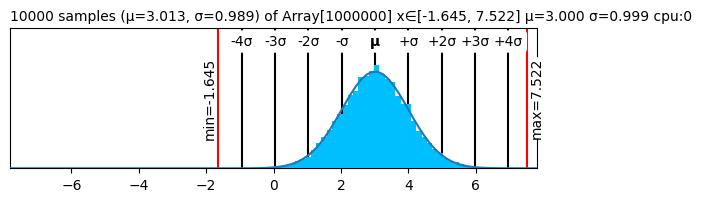
key = jax.random.PRNGKey(0)
t = jax.random.normal(key, (1000000,))+3
plot(t)
 plot (x:jax.Array, center:str='zero', max_s:int=10000, plt0:Any=True,
       ax:Optional[matplotlib.axes._axes.Axes]=None)
| Type | Default | Details | |
|---|---|---|---|
| x | Array | Tensor to explore | |
| center | str | zero | Center plot on zero, mean, or range |
| max_s | int | 10000 | Draw up to this many samples. =0 to draw all |
| plt0 | Any | True | Take zero values into account |
| ax | Optional | None | Optionally provide a matplotlib axes. |
| Returns | PlotProxy |
key = jax.random.PRNGKey(0)
t = jax.random.normal(key, (1000000,))+3

plot(t)
plot(t, center="range")
plot(t, center="mean")
plot(jnp.maximum(t-3, 0))
plot(jnp.maximum(t-3, 0), plt0=False)
fig, ax, = plt.subplots(figsize=(6, 2))
fig.tight_layout()
plot(t, ax=ax);