in_stats = ( (0.485, 0.456, 0.406), (0.229, 0.224, 0.225) )
image = jnp.load("mysteryman.npy").transpose(1,2,0)
image = (image * jnp.array(in_stats[1]))
image += jnp.array(in_stats[0])
image.rgb
 chans (x:jax.Array, cmap:str='twilight', cm_below:str='blue',
        cm_above:str='red', cm_ninf:str='cyan', cm_pinf:str='fuchsia',
        cm_nan:str='yellow', view_width:int=966, gutter_px:int=3,
        frame_px:int=1, scale:int=1, cl:Any=True,
        ax:Optional[matplotlib.axes._axes.Axes]=None)
Map tensor values to colors. RGB[A] color is added as channel-last
| Type | Default | Details | |
|---|---|---|---|
| x | Array | Input, shape=([…], H, W) | |
| cmap | str | twilight | Use matplotlib colormap by this name |
| cm_below | str | blue | Color for values below -1 |
| cm_above | str | red | Color for values above 1 |
| cm_ninf | str | cyan | Color for -inf values |
| cm_pinf | str | fuchsia | Color for +inf values |
| cm_nan | str | yellow | Color for NaN values |
| view_width | int | 966 | Try to produce an image at most this wide |
| gutter_px | int | 3 | Draw write gutters when tiling the images |
| frame_px | int | 1 | Draw black frame around each image |
| scale | int | 1 | |
| cl | Any | True | |
| ax | Optional | None | |
| Returns | ChanProxy |
in_stats = ( (0.485, 0.456, 0.406), (0.229, 0.224, 0.225) )

image = jnp.load("mysteryman.npy").transpose(1,2,0)
image = (image * jnp.array(in_stats[1]))
image += jnp.array(in_stats[0])

image.rgb
chans(image)
# In R
image = image.at[0:32,32:64:,0].set(-1.1) # Below min
image = image.at[0:32,96:128,0].set(1.1) # Above max
# In G
image = image.at[0:32,64:96,1].set(float("nan"))
# In B
image = image.at[0:32,0:32,2].set(float("-inf"))
image = image.at[0:32,128:128+32,2].set(float("+inf"))

chans(image, cmap="viridis", cm_below="black", cm_above="white")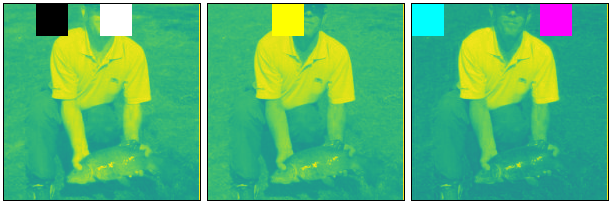
# 4 images, stacked 2x2
chans(jnp.stack([image]*4).reshape(2,2,196,196,3))