import nbdev; nbdev.nbdev_export()
from dotenv import load_dotenv; load_dotenv();🎭 Matplotlib integration
.fig
.rgb, .chans and .plt all have a .fig attribute that returns a matplotlib figure object.
a = numbers.rgb.fig # matplotlib figure
print(type(a))
a
<class 'matplotlib.figure.Figure'>
numbers.chans.fig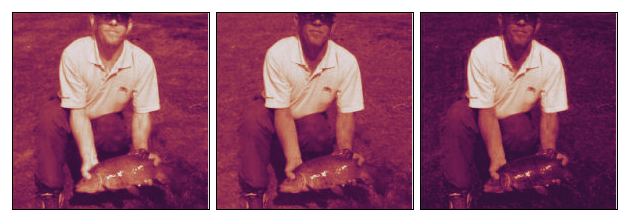
numbers.plt.fig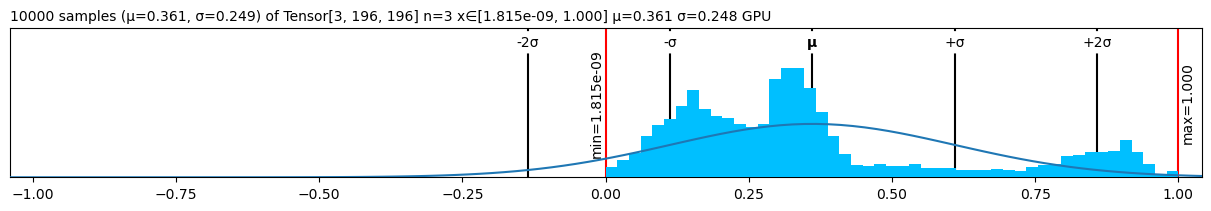
numbers.plt(center="mean").fig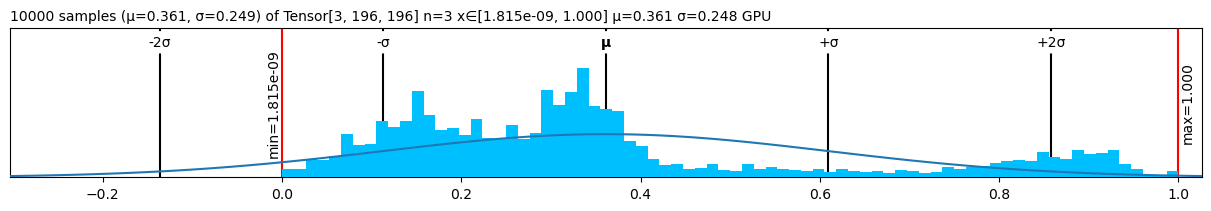
Saving the figure
You can save the figure by calling its savefig method:
numbers.rgb.fig.savefig("tench.jpg")!file tench.jpg; rm tench.jpgtench.jpg: JPEG image data, JFIF standard 1.01, resolution (DPI), density 100x100, segment length 16, baseline, precision 8, 196x196, components 3Using existing Axes
All functions allow an ax= argument that accepts an existing Axes object into which they will plot:
fig = plt.figure(figsize=(8,3))
fig.set_constrained_layout(True)
gs = fig.add_gridspec(2,2)
ax1 = fig.add_subplot(gs[0, :])
ax2 = fig.add_subplot(gs[1, 0])
ax3 = fig.add_subplot(gs[1,1:])

ax2.set_axis_off()
ax3.set_axis_off()

numbers.plt(ax=ax1)
numbers.rgb(ax=ax2)
numbers.chans(ax=ax3);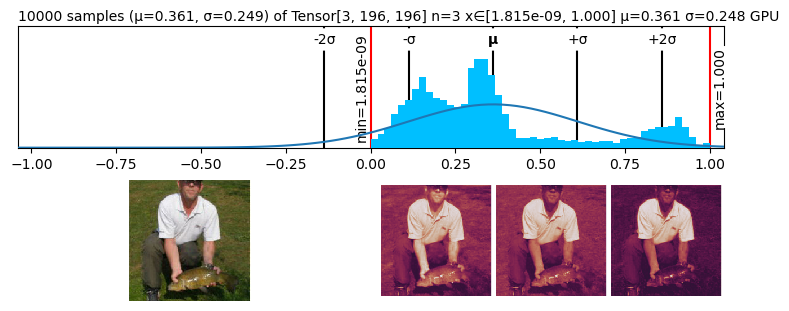
Without Jupyter
By default, the Lovely functions will call plt.close(fig) on the figures they create.
This prevents displaying the figures twice when running in Jupyter.
If you are not using Jupyter, here are 2 configuration options you might want to set:
fig_close=False
#!/usr/bin/env python
from lovely_grad import config, set_config

...

set_config(fig_close=False)
numbers.chans()

# or, using the context manager:
with config(fig_close=False):
    numbers.chans()

plt.show() # Will show all open figures
fig_show=True
If set, lovely will call plt.show() after each figure creation.
You don’t need to set fig_close=False manually.
set_config(fig_show=True)

numbers.chans() # Figure generated and shown

# Note, you have to use the "call" syntax `( )`, as figure
# generation is not triggerd by just accessing the attribute

numbers.chans  # No figure generated

f = numbers.plt.fig # figure generated, shown, and returned.
Note, plt.show() closes all figures.